When a 20 GB Memory Spike Wasn't a .NET Leak
A WPF 3D workflow jumped from roughly 1 GB to as much as 20 GB on one Intel Arc machine. Comparing driver versions and building a distributable repro identified the real layer at fault.
- Intel Arc
- WPF
- .NET
- Graphics
- Memory
- Debugging
The symptom looked like an application leak
On my Intel Arc A750 development machine, a specific 3D rendering workflow could push application memory from a normal range of roughly 750 MB–1.5 GB to temporary peaks between 5 GB and 20 GB. The spike appeared during viewport interaction after realistic shadows were enabled, and the process could become unresponsive for several seconds.
The obvious first hypothesis was an application-level leak. It was a .NET WPF process, the symptom appeared while interacting with our scene, and Windows Error Reporting had produced a RADAR_PRE_LEAK_64 event. But those facts identified the affected process, not the layer allocating the memory.
The most useful clue was social rather than technical: other developers running the same application on different graphics hardware were not seeing the behavior. That made the machine configuration a variable worth isolating instead of assuming that the newest code path was responsible.
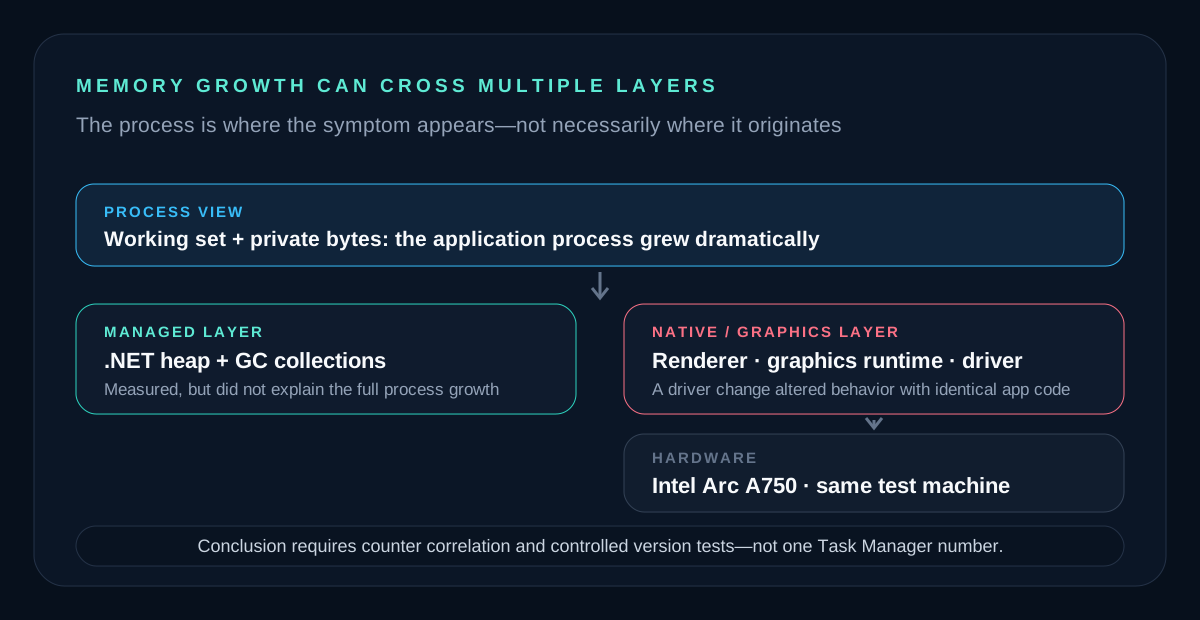
Measure more than one memory counter
Task Manager is useful for noticing a problem, but one number is not enough to explain it. I added lightweight telemetry to the reproduction application so the same UI showed working set, private bytes, managed heap size, garbage-collection counts, and observed peaks while the scene was being manipulated.
This distinction matters. If working set and private bytes grow dramatically while the managed heap remains comparatively small, forcing garbage collection is unlikely to solve the underlying problem. That pattern points toward native allocations, graphics resources, a library boundary, or the driver stack rather than ordinary managed retention.
csharp
MemoryTelemetry.cs
Simplified from the public repro: sample process and managed counters together so they can be compared on the same timeline.
using var process = Process.GetCurrentProcess();
process.Refresh();

long workingSet = process.WorkingSet64;
long privateBytes = process.PrivateMemorySize64;
long managedHeap = GC.GetTotalMemory(forceFullCollection: false);

observedPeakWorkingSet = Math.Max(observedPeakWorkingSet, workingSet);
observedPeakPrivateBytes = Math.Max(observedPeakPrivateBytes, privateBytes);
Change one variable: the graphics driver
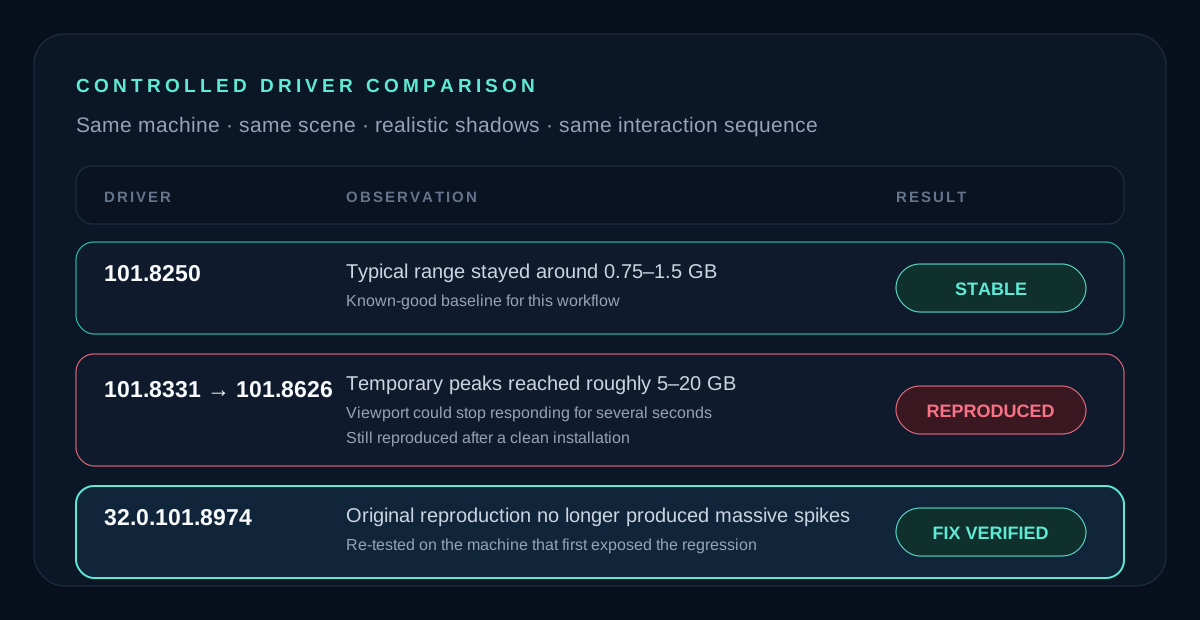
The decisive experiment was not another code change. I kept the machine, application build, scene, shadow setting, and interaction sequence constant, then changed the Intel graphics driver version.
Driver 101.8250 remained stable in this workflow. The behavior appeared consistently with 101.8331 and later versions, and it was still reproducible after a clean installation of 32.0.101.8626. That version boundary changed the diagnosis: the same application and hardware behaved differently depending on the installed driver.
This did not yet prove which internal driver component was responsible, but it was strong evidence against a general application leak. A useful bug report does not need to explain the vendor's implementation; it needs to reduce the search space with a repeatable boundary.
Reduce the trigger to one rendering feature
The original application contained too many possible causes: nested block references, BRep geometry, snapping behavior, viewport interaction, and several rendering features. The next step was to remove product behavior while preserving the workload that made the problem visible.
The isolated trigger became a simple comparison between no shadows and realistic shadows on the same dense cabinet-like scene. Rotate or pan for 15–30 seconds, change the shadow mode, repeat the same interaction, and watch the counters. That made the report testable without sharing the commercial application.
csharp
ShadowModeExperiment.cs
The public repro exposes the suspected feature as an explicit experiment variable.
private void ApplyShadowMode(ShadowMode mode)
{
    viewport.Rendered.ShadowMode = mode;
    viewport.Invalidate();

    sessionLog.Add($"Shadow mode changed to {mode}.");
    CaptureMemorySample();
}

// Compare the same navigation sequence with:
// ShadowMode.None and ShadowMode.Realistic
A reproduction project must be runnable by the recipient
My first handoff exposed another practical lesson. The source project depended on licensed rendering packages that were not available from public NuGet feeds, so Intel's engineer could not restore and build it in a clean lab environment.
The fix was not more setup documentation. I published a self-contained Windows x64 package containing the already-built application and sent a direct release asset. The recipient could extract it and run the executable without Visual Studio, source access, or package credentials.
A minimal reproduction is only useful when the other side can actually execute it. For vendor investigations, reproducibility includes packaging, runtime dependencies, deterministic startup data, and exact interaction steps—not just a small source tree.
powershell
Publish-Repro.ps1
The public repository contains a packaging script that produces a self-contained archive for vendor testing.
dotnet publish .\ReproApp.csproj `
  --configuration Release `
  --runtime win-x64 `
  --self-contained true `
  /p:DebugType=None `
  --output .\artifacts\publish\win-x64

Compress-Archive `
  -Path .\artifacts\publish\win-x64\* `
  -DestinationPath .\artifacts\dist\repro-win-x64.zip
From local suspicion to a driver-team report
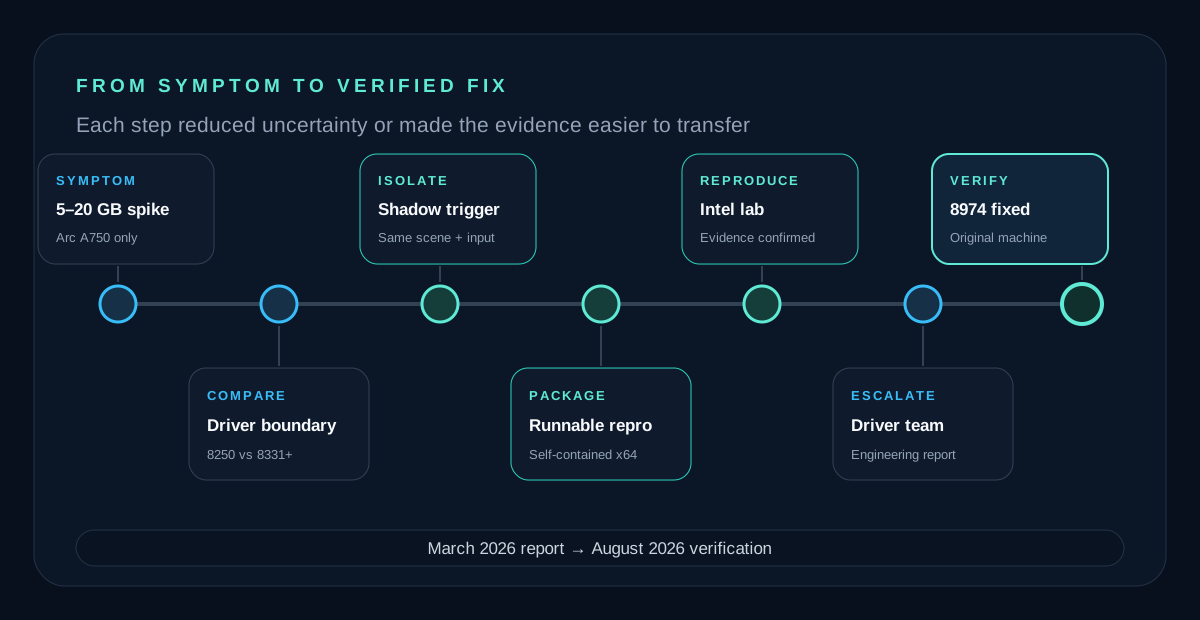
The investigation moved through several layers of support. I provided the driver comparison, system information, clean-install result, exact shadow trigger, public source repository, and prebuilt reproduction package. Intel then tested on an Arc A750 system, reproduced the memory spike and unresponsive behavior with shadows enabled, gathered evidence across additional systems, and escalated the report to the graphics driver team.
Karen Gutiérrez from Intel graphics support followed the technical reproduction closely and kept the case connected to the driver investigation even when automated support notifications created confusion around its status. That continuity mattered: the report had moved beyond generic troubleshooting and needed to remain attached to the engineering evidence already collected.
I am intentionally not publishing personal email addresses, support case numbers, internal tracking identifiers, thread tokens, or private correspondence. Those details add no reusable engineering value to the case study.
Verifying the fix on the original machine
In August, Intel asked me to verify the issue with driver 32.0.101.8974 after their own test no longer showed the previous spikes. I repeated the original scenario on the same Arc A750 machine, using the same application and reproduction workflow.
The massive temporary growth was gone. Memory could still move during rendering—as it should—but it remained stable instead of jumping into the 5–20 GB range and making the process unresponsive.
That final test is important. A vendor saying that a change is available is not the same as closing the loop. The regression should be re-tested on the environment that originally exposed it, with the same trigger and the same counters used during diagnosis.
A debugging checklist for hardware-specific failures
This case reinforced a debugging method that applies well beyond graphics drivers. When a failure appears on only one machine or hardware family, the goal is to turn environmental differences into controlled experiment variables.
- Confirm whether the behavior follows the application build, the data, the machine, or the hardware family.
- Measure managed and native-facing process counters instead of labeling every increase a .NET leak.
- Change one environmental variable at a time and keep the workload constant.
- Find a known-good and known-bad version boundary whenever possible.
- Reduce the trigger to the smallest feature toggle and deterministic interaction sequence.
- Ship a prebuilt reproduction when the source depends on licensed or private packages.
- Record exact versions, steps, counters, and observed ranges without overstating what they prove.
- Re-run the original scenario after the proposed fix; do not validate on a different path.
Share